View/Export Results
Manage Existing Surveys
Create/Copy Multiple Surveys
Collaborate with Team Members
Sign inSign in with Facebook
Sign inSign in with Google

Brand Perception Survey Template

A 17-question brand perception survey that rates your brand and one named alternative on the same six attributes, item by item. Take it here, copy the questions, or open it in the editor and type your own brand names.

  • 17questions
  • About 4 minto complete
  • 2 brandsrated on the same 6 attributes
  • Attribute gaparithmetic you can do on paper
Brand Perception Survey · answer to move through it
Use this template
Question 1 of 17 Familiarity
How well do you know [YOUR BRAND]?
1
2
3
4
5
Never heard of itKnow it well
Question 2 of 17 Familiarity
How well do you know [ALTERNATIVE A]?
1
2
3
4
5
Never heard of itKnow it well
Question 3 of 17 Your brand
[YOUR BRAND] makes good quality [PRODUCTS].
1
2
3
4
5
Strongly disagreeStrongly agree
Question 4 of 17 Your brand
[YOUR BRAND] is good value for what it costs.
1
2
3
4
5
Strongly disagreeStrongly agree
Question 5 of 17 Your brand
[YOUR BRAND] does what it says it will do.
1
2
3
4
5
Strongly disagreeStrongly agree
Question 6 of 17 Your brand
[YOUR BRAND] is easy to deal with.
1
2
3
4
5
Strongly disagreeStrongly agree
Question 7 of 17 Your brand
[YOUR BRAND] offers something I cannot get from the others.
1
2
3
4
5
Strongly disagreeStrongly agree
Question 8 of 17 Your brand
[YOUR BRAND] understands people like me.
1
2
3
4
5
Strongly disagreeStrongly agree
Question 9 of 17 The alternative
[ALTERNATIVE A] makes good quality [PRODUCTS].
1
2
3
4
5
Strongly disagreeStrongly agree
Question 10 of 17 The alternative
[ALTERNATIVE A] is good value for what it costs.
1
2
3
4
5
Strongly disagreeStrongly agree
Question 11 of 17 The alternative
[ALTERNATIVE A] does what it says it will do.
1
2
3
4
5
Strongly disagreeStrongly agree
Question 12 of 17 The alternative
[ALTERNATIVE A] is easy to deal with.
1
2
3
4
5
Strongly disagreeStrongly agree
Question 13 of 17 The alternative
[ALTERNATIVE A] offers something I cannot get from the others.
1
2
3
4
5
Strongly disagreeStrongly agree
Question 14 of 17 The alternative
[ALTERNATIVE A] understands people like me.
1
2
3
4
5
Strongly disagreeStrongly agree
Question 15 of 17 First choice
If you were choosing one of these today, which would you go with?
[YOUR BRAND]
[ALTERNATIVE A]
Another brand
I would not choose any of them
Question 16 of 17 Your words
In your own words, why that brand and not the other?
Question 17 of 17 Overall
Overall, I think highly of [YOUR BRAND].
1
2
3
4
5
Strongly disagreeStrongly agree

Which brand comparison can you actually run?

Four designs could compare two named brands. Three need no bought panel, and only one of those three returns a number per attribute. That one is this template.

The comparison happens inside one person. A generous rater marks both columns high and a hard one marks both low. The habit sits on both sides and drops out when you subtract, so a difference survives a small sample when an absolute score does not.

A brand tracking survey is this instrument on a clock. A brand health survey is the same items on a dashboard. Brand equity survey questions add a price premium item as a seventh attribute. All 17 are built in the free questionnaire maker already.

A brand perception survey asking the same six attribute items about two named brands, one brand to a screen, with a familiarity check standing in front of both
One block of items, asked twice. Everything the gap needs comes from asking the same words about both brands.
DesignWhat the respondent doesWhat it needsWhat you get
Attribute rating across named brandsJudges each brand on the same short list, one brand per screenTwo or three brands your buyers already knowA difference per attribute, worked out inside each respondent
MaxDiffPicks the best and the worst item from small sets, over and overAt least 300 respondents in total and 200 for any subgroup you want to report, rising with the item count[1]A ranking of how much items matter, not where a brand stands
A single preference pickChooses one brandNothing you do not already haveWho wins, with no reason attached
One open question about competitorsTypes a sentenceTime to read every answerQuotes you cannot count, compare or repeat next wave

None of these is wrong, only aimed elsewhere. MaxDiff ranks how much items matter, not where a brand sits. Nothing in this template asks anyone to order a list or split 100 points, and an ordering question would not subtract even if you added one. Every judgement here is a rating, which is what makes it subtractable.

Published sample-size advice runs to several hundred responses a wave and assumes a bought panel.[2][3] With forty answers from your own list, the two absolute scores are worth little and the difference between them is still readable. To describe a whole category instead, use a market research survey.

The 17 brand survey questions, asked item by item

Every question, its scale, and what a poor answer tells you. Copy one block, copy all 17, or open the template and change the names.

Plain text, one question per line, with the answer scale.

Familiarity screen

Nobody can judge a brand they have never met. These two answers decide whose ratings you keep.

  1. How well do you know [YOUR BRAND]?5-point, never heard of it to know it wellA 1 or a 2 means everything that follows is a guess. Only people who know both brands go into either average.
  2. How well do you know [ALTERNATIVE A]?5-point, never heard of it to know it wellIf most of your sample cannot place the alternative, you have no comparison yet, only people rating a name.

Your brand, six attributes

Six things you could act on this quarter, asked one per screen. The same six words go to the alternative next, or nothing subtracts.

  1. [YOUR BRAND] makes good quality [PRODUCTS].5-point agreeThe attribute buyers assume you have. A low score here outranks every other gap on the page.
  2. [YOUR BRAND] is good value for what it costs.5-point agreeValue, not price. A brand can be the expensive one and still score high here.
  3. [YOUR BRAND] does what it says it will do.5-point agreeBroken promises show up here long before they show up in the open answer.
  4. [YOUR BRAND] is easy to deal with.5-point agreeLow here with a high quality score means the product is fine and the process is not.
  5. [YOUR BRAND] offers something I cannot get from the others.5-point agreeThe one attribute where drawing level with the alternative is a bad result, not a neutral one.
  6. [YOUR BRAND] understands people like me.5-point agreeLow here and high everywhere else usually means you are selling to people you are not speaking to.

The named alternative, same six attributes

Word for word the same six items, asked second, one brand per screen. Change a single word and the subtraction stops meaning anything. All six are optional, so anyone who has never heard of this brand can skip them.

  1. [ALTERNATIVE A] makes good quality [PRODUCTS].5-point agreeIf this beats your own quality answer, the quality argument is not yours to make this year.
  2. [ALTERNATIVE A] is good value for what it costs.5-point agreeThe gap that moves fastest when either side changes a price.
  3. [ALTERNATIVE A] does what it says it will do.5-point agreeA rival ahead here is holding trust you thought you had.
  4. [ALTERNATIVE A] is easy to deal with.5-point agreeThe gap small firms most often win and most often forget to say out loud.
  5. [ALTERNATIVE A] offers something I cannot get from the others.5-point agreeIf they score as high as you do, neither brand is distinct and price decides.
  6. [ALTERNATIVE A] understands people like me.5-point agreeA rival ahead here is talking to your buyers better than you are.

First choice and the open answer

One outcome item the six gaps have to explain, and one open answer set before the end so people still have a reason to type.

  1. If you were choosing one of these today, which would you go with?Choose oneThe number every stakeholder asks for, and the one that explains nothing on its own.
  2. In your own words, why that brand and not the other?Open text, optionalRead these before you open a chart. They name the attribute the ratings only hint at.

The closing rating

A rating is one tap, so it is the safest question to put last, and it gives one overall number to sit beside the six differences.

  1. Overall, I think highly of [YOUR BRAND].5-point agreeThe summary figure people want. Report it under the gaps, never instead of them.

Four placeholders to replace before you send. [YOUR BRAND] and [ALTERNATIVE A] in every item, [PRODUCTS] in the two quality statements, and [YOUR ORGANISATION] in the first-screen text further down. The wording is ours: copy, edit and translate it, then freeze it, because a changed word ends the trend.

The ceiling on this block. Six attributes and two brands is 12 judgements. Eight and three is 24. Answers late in a questionnaire come back faster and shorter,[4] so keep attributes times brands under about 18, and cut an attribute before you add a brand.

How to work out the attribute gap

One subtraction per person per attribute. It is a spreadsheet column, not a model.

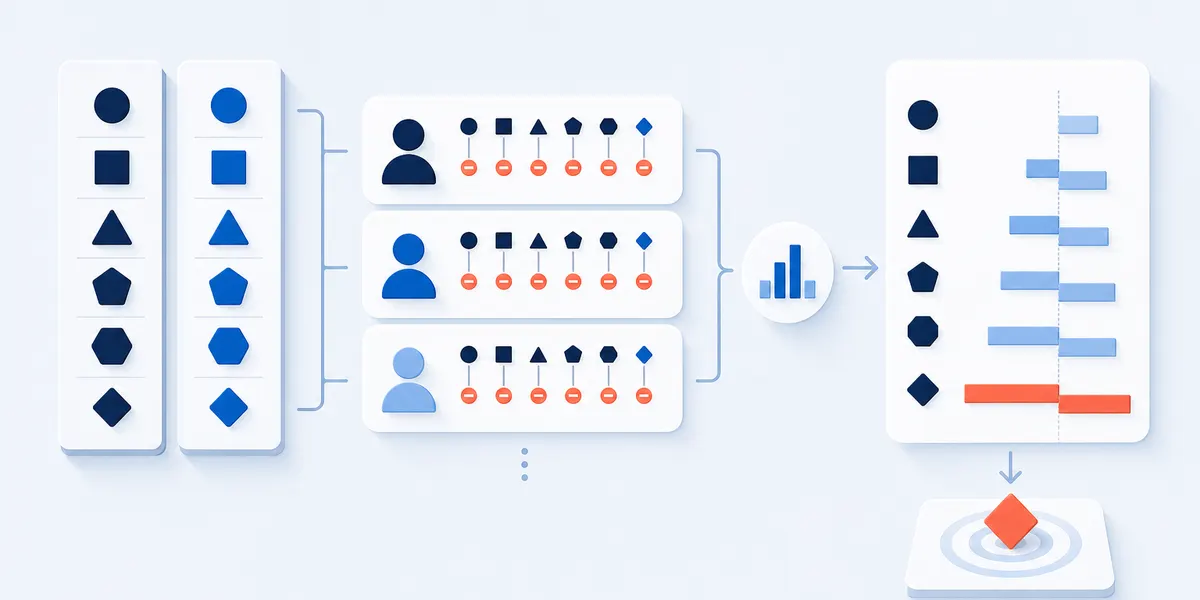
The arithmetic. For one person and one attribute, subtract their rating of the alternative from their rating of your brand. Do that six times, then average each attribute across everyone who rated both brands. Sort by the average difference and read the bottom first, because a total across six attributes hides the one that is losing. Put the count of people behind each number beside it.

AttributeYour brandThe alternativeAverage difference
Quality4.23.7+0.5
Value for what it costs3.14.0-0.9
Does what it says4.03.8+0.2
Easy to deal with4.33.4+0.9
Offers something the others do not3.33.4-0.1
Understands people like me3.63.9-0.3

Value is the loss here, by a distance. Ease is a win nobody is claiming out loud. A tie on offering something the others do not is also a loss. Split the six differences by what people picked at question 15 to see which attribute separates their choosers from yours.

How small a gap is noise. On 40 answers, one person moving an attribute by a point moves that average by 0.025. A tenth or two is not a result; the widest gap usually is. Your only reference point is your own previous wave.

An attribute gap read as the distance between one brand and a named alternative on the same six items, ranked with the widest loss at the bottom
Subtract inside each person, then average. The widest negative bar is where you lose, and that is where the work goes.

Which brands to name

Two names decide whether the data is comparable. One question decides whose answers you keep.

Name the brand your buyers name, not the biggest in the category: the one people mention when they tell you no. Competitors sort into four kinds, direct, indirect, substitute and new entrant,[7] and this survey works on the first two. Two brands is the default. A third costs six more judgements and buys one column.

One filtering rule, and it is not brand by brand. Keep the people who said they know both brands, drop the rest, and write down how many that removed. Filtering brand by brand would average your two columns over different people, which is the one thing the subtraction cannot survive. If most of your sample cannot place either name, run a brand awareness survey first.

If the question is which candidate name to launch, that is a naming survey. For the alternatives in play inside a live buying window, send the buying intentions survey.

First-screen text

About this survey

This survey asks the same questions about [YOUR BRAND] and [ALTERNATIVE A]. We are not connected to [ALTERNATIVE A]. We ask about both because a rating only means something next to another one.

There are 17 questions and it takes about four minutes. If you have never heard of [ALTERNATIVE A], say so in the second question and skip its six ratings.

[YOUR ORGANISATION] runs this survey and can see every answer. No name or email address is asked for.

What your own customer list cannot tell you

Everyone on your list picked you once. They rate you kindly and rate the alternative from the outside, often without having used it, so your column is flattered and theirs is not.

What you might writeWhat your own list can carryWrite this instead
We score 4.2 on qualityNothing about the category: only people who already chose you answeredReport the difference, and say who answered
We beat the alternative on three of six attributesOnly among people who know both brandsPrint how many rated both, next to the claim
Perception improved since last waveOnly if the words, the brand order and the kind of list held stillSay what changed in the sample first
Forty percent would pick us firstNot a standing in the categoryUse question 15 to explain the gaps, nothing else

Keep the brand order fixed. Ask your brand first and the alternative second, one brand a screen, every wave. Whichever block comes first carries a small edge, so compare wave against wave and never one order against the other.

Whether the people who already chose you will do it again is a customer loyalty survey. How the money splits between you and them is a share of wallet survey.

If you need a market number, this is not the survey that gives it to you. A read on people who chose neither brand needs a sample your own list does not contain. Send it past your own list, to a partner list or a category community, and say who answered.

Brand perception survey FAQ

Can I ask about a competitor in my own survey?

Yes. You name the brands, ask the same items about each, and say on the first screen that the survey covers more than one brand.

Is this the same as measuring whether people have heard of us?

No. That is a memory question and it comes first. This survey asks people who already know both brands to judge them on the same six things.

Is brand perception the same as brand image?

In practice people use the two words for one thing. What matters is how you measure it: adjectives people volunteer cannot be subtracted, and ratings on named attributes can.

What is a good brand perception score?

There is no published one, and any table handing you a band is describing a different instrument. This template produces six differences rather than a score, on purpose, and until you have a previous wave the widest gap is the finding.

How often should we run a brand tracking survey?

Twice a year suits most businesses, plus a wave after anything that would change the answer: a price move, a launch, a rival arriving.

Methods and sources

What this template is based on

The block size and its item-by-item form follow published work on questionnaire position effects, on splitting grids and on forced choice against check-all lists.[4][5][6]

Question licensing

Nothing licensed appears. There is no rights-held scale behind this subject, so all 17 items are original and free to edit, translate and redistribute. MaxDiff is named as a method only, sourced to its vendor.[1]

Limits and disclosure

The sample-size advice quoted here is vendor guidance, not a trial result. Run on your own list, the absolute ratings describe people who already chose you, and the differences do not extend to the category. No benchmark exists for an attribute gap, so the only reference point is your own previous wave.

SuperSurvey makes the editor this template opens in and sells no respondent panel, so the sampling advice above costs us nothing to give. The template is free either way.

References

  1. Sawtooth Software. MaxDiff Sample Size Calculation Best Practices. Sawtooth Software, 2024. sawtoothsoftware.com
  2. SurveyMonkey. How to measure, understand and track brand perception. SurveyMonkey Market Research Resources. surveymonkey.com
  3. QuestionPro. Brand Perception Surveys: How They Improve Brand Image. QuestionPro blog. questionpro.com
  4. Galesic, M. and Bosnjak, M. "Effects of Questionnaire Length on Participation and Indicators of Response Quality in a Web Survey." Public Opinion Quarterly 73, no. 2 (2009). academic.oup.com
  5. Couper, M.P., Tourangeau, R., Conrad, F.G. and Zhang, C. "The design of grids in web surveys." Social Science Computer Review 31, no. 3 (2013). pmc.ncbi.nlm.nih.gov
  6. Lau, A. and Kennedy, C. When Online Survey Respondents Only Select Some That Apply. Pew Research Center, 2019. pewresearch.org
  7. Qualtrics. Competitor analysis and competitive market research. Qualtrics Experience Management. qualtrics.com

Send the brand perception survey this week

Seventeen questions, about four minutes, two brands judged on the same six attributes. Type your two brand names and share one link.

Use this template