
Brand perception survey: your brand and one named alternative
An 18-question brand perception survey that puts two named brands through word-for-word identical question blocks in one sitting, so the difference is worked out inside each respondent. Take it below, or copy the questions.
- 18questions
- About 5 minto complete
- 2 brandssame 7 statements each
- 2 versionsto cancel the order effect
What a brand perception survey compares
One respondent, two named brands, the same seven statements about each.
The subtraction happens inside one person. A generous rater marks both brands high and a hard one marks both low. That habit cancels when you subtract, so a difference survives forty answers when neither score would.
Name the brand your buyers name, not the biggest in the category: the one people mention when they tell you no. Competitors sort into direct, indirect, substitute and new entrant,[5] and this works on the first two.
Filter on both brands, never one. Keep the people who know both, drop the rest, and write down how many that removed. Filtering brand by brand averages the columns over different people, which kills the subtraction.

What this page is not. Whether people can name you unprompted is a brand awareness survey, asked in fixed order so nothing prompts the first answer. Whether buyers who chose you once will do it again is a brand loyalty survey.
Sizing a category is a market research survey. All 18 questions are already built in the free questionnaire maker.
The 18 questions, asked once about each brand
Every question, its scale, and what a poor answer tells you.
Familiarity screen
Nobody can judge a brand they never met. These two answers decide whose ratings you keep.
- How well do you know [BRAND A]?A 1 or a 2 and everything after it is a guess.
- How well do you know [BRAND B]?If most cannot place one name, they are rating a word.
The first brand, seven statements
Six things you could act on plus one overall. The same seven words go to the second brand, or nothing subtracts.
- [BRAND A] makes good quality [PRODUCTS].Behind here and nothing else outranks it.
- [BRAND A] is good value for what it costs.Value, not price. The dearer brand can still win.
- [BRAND A] does what it says it will do.Broken promises land here first.
- [BRAND A] is easy to deal with.High quality above this means the process, not the product.
- [BRAND A] offers something I cannot get from the others.Drawing level here is a bad result.
- [BRAND A] understands people like me.Low here, high elsewhere: wrong buyers.
- [BRAND A] is a brand I think highly of.Report it under the six, never instead.
The second brand, the same seven statements
The same block, word for word. Change one word and the subtraction stops meaning anything, and so does the swap.
- [BRAND B] makes good quality [PRODUCTS].Ahead here and the quality argument is not yours.
- [BRAND B] is good value for what it costs.Moves fastest when a price changes.
- [BRAND B] does what it says it will do.Ahead here holds trust the other thought it had.
- [BRAND B] is easy to deal with.What small firms win and forget to say out loud.
- [BRAND B] offers something I cannot get from the others.Level here and price decides.
- [BRAND B] understands people like me.Ahead here means they talk to the same buyers better.
- [BRAND B] is a brand I think highly of.Two overalls level while statements move is a finding.
First choice and the open answer
One outcome the seven differences must explain, then one open answer.
- If you were choosing one of these today, which would you go with?The number stakeholders ask for, and it explains nothing alone.
- In your own words, why that brand and not the other?Read these before any chart. They name what the ratings only hint at.
Three placeholders. [BRAND A] and [BRAND B] in every item, [PRODUCTS] in the quality statements, [YOUR ORGANISATION] in the first-screen text below. Edit the wording, then freeze it: a changed word ends the trend.
One brand to a screen, not a two-column grid. A grid putting both brands on one row invites people to answer straight down a column, and grid layout changes the answers collected.[3]
The ceiling. Seven statements about two brands is 14 judgements; about three it is 21, and answers late in a questionnaire come back faster and shorter.[2] Cut a statement before you add a brand.
Order effects, and the two-version fix
Whichever brand is asked about first is not measured the same way as the one asked about second. The real risk here, and cheap to remove.
The problem. Question order is a documented source of bias: "the order in which questions are asked can influence how people respond", and earlier questions supply context for the ones that follow.[1] Somebody rating the second brand has just rated the first on the same seven words. The two directions have names, contrast where the difference widens and assimilation where the sets converge, and both are possible here. No published figure says how large the effect is on a comparison of this shape, so any adjustment would be invented. Remove it instead.
Build the survey twice. Version one puts your brand in the [BRAND A] slot; version two the other way round. Send half your list each link, then pool by brand name rather than by slot. Each brand has now been rated first by half its raters and second by the rest.
Why the swap is a swap. The two blocks are word for word identical apart from the name in front of each statement, and both are optional because either brand can be the one a respondent has never met. Change one word in one and the swap stops being a swap.
You also get to measure the effect. Subtract your own brand's average when it went second from its average when it went first. If that rivals the differences you are reporting between the brands, position is doing more work than the brands are.
If you will only run one version, hold the slots still every wave and never read one wave against one that ran the other way round. Tell people they may skip either block,[4] as the first-screen text does.
First-screen text
About this survey

[YOUR ORGANISATION] runs this survey and can see every answer. One of the two brands below is ours. We ask about both because a rating means little until there is another one beside it.

There are 18 questions, about five minutes. If you have never heard of one brand, say so in the first two questions and skip its seven ratings. No name or email address is asked for.
Working out the attribute gap
One subtraction per person per statement. A spreadsheet column, not a model.
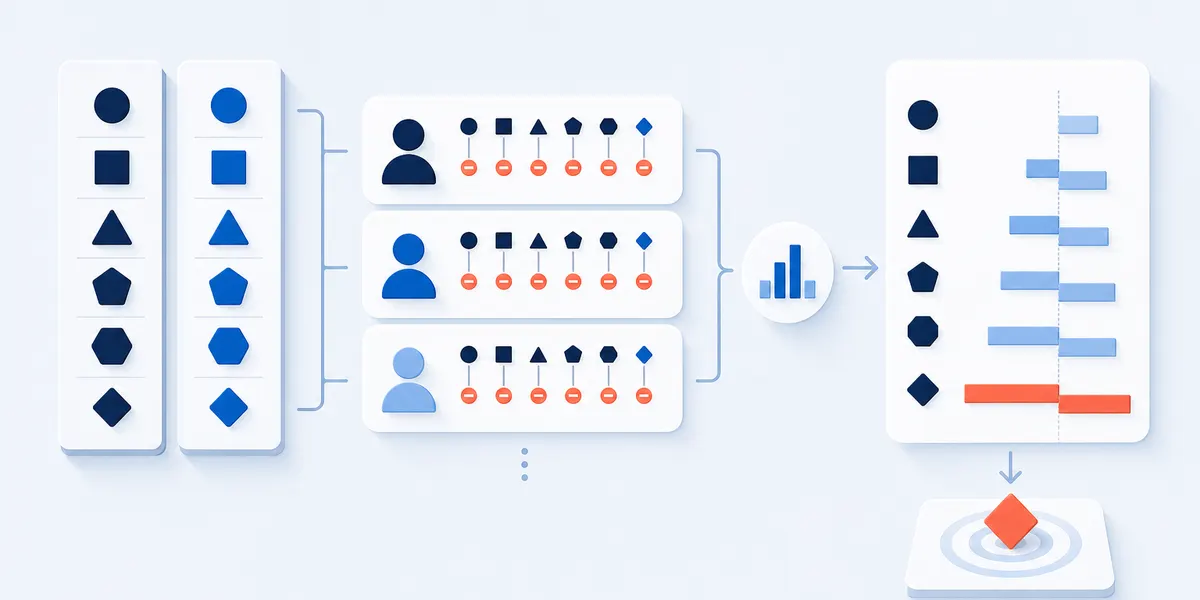
The arithmetic. For one person and one statement, subtract their rating of one brand from the other, by brand name rather than by slot. Do that seven times, average each across everybody who rated both, then read the sorted list from the bottom.
| Statement | Your brand | The alternative | Average difference |
|---|---|---|---|
| Quality | 4.2 | 3.7 | +0.5 |
| Value for what it costs | 3.1 | 4.0 | -0.9 |
| Does what it says | 4.0 | 3.8 | +0.2 |
| Easy to deal with | 4.3 | 3.4 | +0.9 |
| Offers something the others do not | 3.3 | 3.4 | -0.1 |
| Understands people like me | 3.6 | 3.9 | -0.3 |
| Think highly of it, overall | 3.8 | 3.8 | 0.0 |
Value is the loss here by a distance, ease is a win nobody is saying out loud, and a tie on offering something the others do not is a loss dressed as a draw. The overall row level while four statements move is the useful part: the brands land in the same place for different reasons.
How small a difference is noise. On 40 answers, one person moving a statement by a point moves that average by 0.025. A tenth or two is not a result; the widest difference usually is.
What your own customer list cannot tell you
Everyone on your list picked you once. They rate you kindly and the alternative from the outside, so one column is flattered.
Report the difference, never the level. "We score 4.2 on quality" says nothing about the category: only your own buyers answered. "We beat them on four of seven" holds only among people who know both brands. "Perception improved" holds only if the words and slots stayed still.
If you need a number about the market, this is not the survey. A read on people who chose neither brand needs a sample your list does not contain. Send it to a partner list or a category community, and say who answered.
How the money splits between the brands is a share of wallet survey. Which alternatives are live inside a purchase window is a buying intentions survey.
When the value row is the loss, the price itself is a price evaluation survey.
Brand perception survey FAQ
Can I ask about a competitor in my own survey?
Yes. Name both, ask the same statements about each, and say on the first screen that one of the two is yours. Which one is the part to leave out.
Does it matter which brand is asked about first?
Yes, and that is what the two-version design on this page is for. The first brand is rated with nothing beside it; the second by somebody who just worked through the same seven statements. Running the survey twice with the names swapped removes the effect and measures it.
What is a good brand perception score?
There is no published one, and any table handing you a band is describing a different instrument. This template produces seven differences rather than a score, and until you have a previous wave the widest is the finding.
Perception rates a brand on attributes. A profile rates nothing and judges nobody, so the customer profile questions collect only what a reader would act on.
Methods and sources
What this template is based on
Two familiarity items decide whose ratings count, then two identical seven-statement blocks, a brand to a screen rather than a grid,[3] then a first choice and an open answer. Order handling follows published guidance on question order;[1] block size follows work on position effects.[2]
Question licensing
Nothing licensed appears. There is no rights-held scale behind this subject, so all 18 items are original and free to edit, translate and redistribute.[1]
Limits and disclosure
Run on your own list, the ratings describe people who already chose you and do not extend to the category. No benchmark exists for a difference of this kind, so your only reference point is your previous wave. Order effects are designed around rather than quantified: no published figure describes their size on a comparison of this shape. The competitor typology is vendor guidance.[5]
SuperSurvey makes the editor this template opens in and sells no respondent panel, so the sampling advice costs us nothing.[4]
References
- Pew Research Center. Writing Survey Questions, "Question order". pewresearch.org
- Galesic, M. and Bosnjak, M. "Effects of Questionnaire Length on Participation and Indicators of Response Quality in a Web Survey." Public Opinion Quarterly 73, no. 2 (2009). academic.oup.com
- Couper, M.P., Tourangeau, R., Conrad, F.G. and Zhang, C. "The design of grids in web surveys." Social Science Computer Review 31, no. 3 (2013). pmc.ncbi.nlm.nih.gov
- American Association for Public Opinion Research. "Best Practices for Survey Research." aapor.org
- Qualtrics. Competitor analysis and competitive market research. qualtrics.com
Send the brand perception survey
Eighteen questions, two brands, the same seven statements. Share one link, or two with the names swapped.
Use this template