View/Export Results
Manage Existing Surveys
Create/Copy Multiple Surveys
Collaborate with Team Members
Sign inSign in with Facebook
Sign inSign in with Google

NPS Survey Template

A 7-question NPS survey. The 0 to 10 recommend question comes first because it is the number, then six questions that tell you why. Take it here, score your own responses in the calculator, or open it in the editor and change the wording.

  • 7questions
  • About 2 minto complete
  • 0 to 10plus six follow-ups
  • Anonymousno email field
NPS Survey · answer to move through it
Use this template
Question 1 of 7 The number
How likely are you to recommend us to a friend or colleague?
0
1
2
3
4
5
6
7
8
9
10
Not at all likelyExtremely likely
Question 2 of 7 Why
What is the main reason for the number you gave?
Question 3 of 7 Why
What would we have to do to earn a 10 from you?
Question 4 of 7 Drivers
What we sell does what I need it to do.
1
2
3
4
5
Strongly disagreeStrongly agree
Question 5 of 7 Drivers
When I needed help, I got it quickly.
1
2
3
4
5
Strongly disagreeStrongly agree
Question 6 of 7 Segment
How long have you been buying from us?
Less than 3 months
3 to 12 months
1 to 3 years
More than 3 years
Question 7 of 7 Closing rating
How likely are you to buy from us again?
1
2
3
4
5
Very unlikelyVery likely

What an NPS survey measures

One question produces the number. Everything after it exists to explain the number, which is the half most surveys skip.

The question. "How likely are you to recommend us to a friend or colleague?", answered from 0 to 10. The wording is free to use. Net Promoter and NPS are trademarks with three owners; this page refers to them factually and claims no licence or approval from anyone.[1] The methods section carries the full attribution.

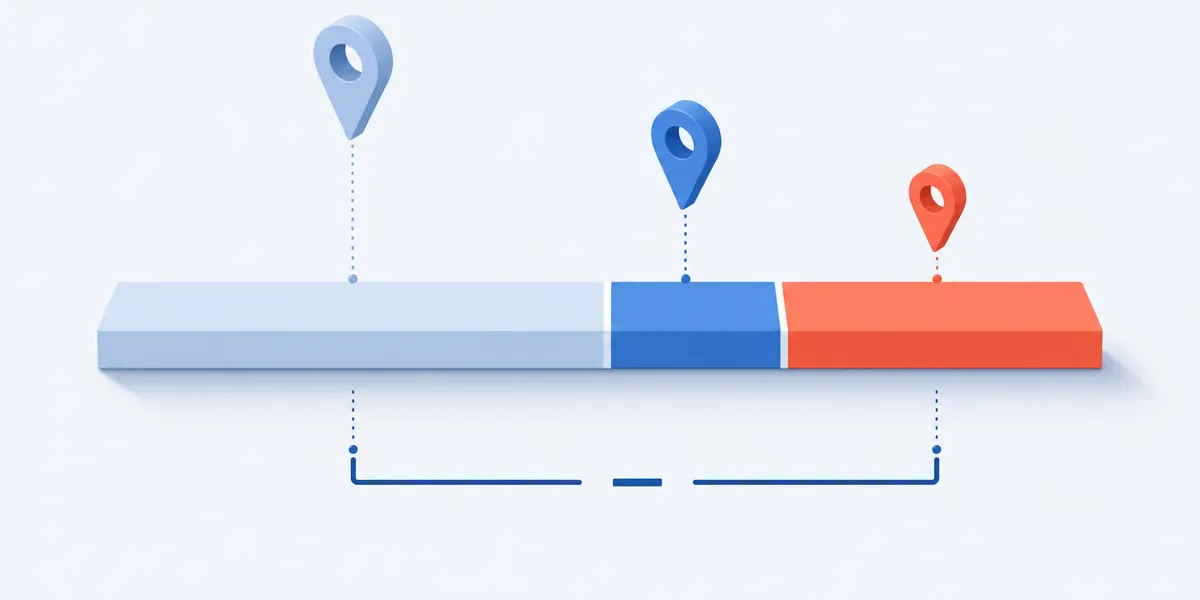
The three bands. A 9 or a 10 is a promoter. A 7 or an 8 is a passive. Anything from 0 to 6 is a detractor. Your result is the percentage of promoters minus the percentage of detractors, which is why it runs from -100 to +100 rather than 0 to 100.

Passives count for nothing: they sit in the total and in neither percentage, which drags the result down without a single point ever being subtracted. Most people do not know this: an 8 feels generous and scores zero, a 6 feels like a pass and costs you. Say so in the survey intro.

Why it goes first. In our own measurement of surveys built on this platform, the 0 to 10 recommend item is answered by 95.0% of the people who reach it, in a median of 4.0 seconds, across 3,013 askings, the fastest question type in the dataset.[4] That is a smaller sample than the other question types in the same table, so read it as what we measured, not a law. It is still the argument for asking it first and for keeping everything after it short.

Then the follow-ups. Six short questions: two open boxes for the reason, two drivers you can act on, one segment, and a closing rating. All seven are already built, scale labels included, in the free online survey maker.

One long horizontal scale bar split into three zones by two dividers, with marker pins above each zone and a subtraction bracket beneath the outer two
One question, three bands, and a subtraction.

This is not a satisfaction survey. Satisfaction asks how one interaction went; this asks whether the relationship is good enough for someone to put their own name behind it. For a single purchase or ticket, use the customer satisfaction survey template. For written feedback rather than a number, start from the customer feedback survey.

For which part of the service is dragging the number down, the SERVQUAL questionnaire has five gaps to check instead of one score.

NPS calculator, and how to calculate NPS by hand

Type in how many people gave each answer. The result updates as you go, and the arithmetic is written out underneath.

Work out your result

0%
0%
0%
0 NPS from 0 responses

Counts of people, not percentages. Calculated in your browser; nothing is sent anywhere.

The arithmetic, worked through

Say 500 people answered. 240 of them chose 9 or 10, 160 chose 7 or 8, and 100 chose something from 0 to 6.

Promoters are 240 of 500, which is 48 percent. Detractors are 100 of 500, which is 20 percent. Subtract: 48 minus 20 is 28, so the result is +28. The 160 passives never appear in either percentage, but sit in both denominators, pulling the number down without being counted against you.

Two common mistakes: averaging the 0 to 10 answers instead, which is a different number entirely, and dropping passives from the denominator, which inflates the result. Keep them in the total and out of both percentages.

What the number is worth at 20 responses

Here are the same proportions at two sample sizes, with one change: two detractors having a better week and answering 9 instead.

ResponsesPromotersPassivesDetractorsResultIf two detractors had said 9
20965+20+40
200906050+20+22

Two people move a 20-response result by 20 points; the same two move a 200-response result by two. That is not a flaw in your survey: it is what subtracting two percentages does at small numbers, since each proportion carries its own error.

Under about 50 responses, publish the band counts and comments rather than the single figure; between 50 and 200, publish the number with the count beside it and ignore any move under about ten points. Usability researchers agree: the measure is "rarely relevant with a small sample size".[7]

Small samples are not a reason to skip the survey. At 20 responses the twenty comments are still twenty things you did not know; they are just not a measurement.

One honest caution: the strongest independent study found this predicts growth in some industries and not in others,[2] and Bain's own 2021 review admits that tying the score to frontline pay turned it into a vanity statistic.[3] Published benchmarks will not rescue the number either: tables disagree by more than 30 points for the same sector,[5] so track your own trend on identical wording instead of a published table.

An NPS score plotted as four quarterly markers on a rising line with a margin band around it
One reading tells you little. Four quarters of the same question tell you the direction.

The 7 NPS survey questions

Every question, its scale, and what a low answer is telling you. Copy a block or the whole set into your own tool.

Plain text, one question per line, with the answer scale.

The one question that makes the number

The whole method, first, so an early abandon still gives you the number.

  1. How likely are you to recommend us to a friend or colleague?0 to 10Answers of 9 or 10 are promoters, 7 or 8 are passives, 0 to 6 are detractors. Swap "us" for your company name and nothing else.

The two questions that tell you why

The number moves and nobody knows why; these two are the part you can act on. Both are optional, on purpose.

  1. What is the main reason for the number you gave?Open text, optionalThe single most useful question on the page. Tag every answer with one theme and count the themes.
  2. What would we have to do to earn a 10 from you?Open text, optionalAsks for the fix instead of the complaint, producing shorter, more specific answers than "how can we improve".

Two drivers you can actually do something about

Two closed questions to split the number by something other than the comments: product fit and speed of help.

  1. What we sell does what I need it to do.5-point agreeProduct or service fit. Low here with a decent number usually means people tolerate you rather than like you.
  2. When I needed help, I got it quickly.5-point agreeSpeed of help. The fastest driver to fix and the one most often behind a detractor comment.

One segment, then a closing rating

Tenure is the one cut worth having: new and long-standing customers answer differently. It closes on a rating scale, the ending that loses fewest answers in our data.

  1. How long have you been buying from us?Choose oneSplit the result by this before you split it by anything else. Group customers of under three months separately.
  2. How likely are you to buy from us again?5-point likelihoodRepurchase intent. A useful sanity check: recommending and buying again are not the same promise.

Where this wording comes from. The recommend question is the standard one, in plainer English, and free to use when attributed.[1] The other six are ours; nothing here reproduces a licensed or paid instrument.

What we left out, and why. No email field: it is the most requested addition and the most expensive. Ending a survey on an email address costs real answers at that step. Send to a list you already have, or let people leave contact details inside the open box if they want a reply. No age, gender or location fields either; they explain nothing here and make an anonymous survey identifiable.

How to run an NPS survey in six steps

The recommend question is the fastest thing in this survey to answer. Here is a send plan built around that.[4] What every survey shares, one link, one reminder, a stated length and a closing date, is in the survey research guide rather than repeated here.

95.0%answer the recommend question once they reach itthe highest completion of any item we measured
4.0 secondsmedian time to answer itthe fastest question type in the dataset
3,013askings measureda smaller sample than other question types, read it as what we saw
  1. Decide which question you are answering

    Relational for the trend, transactional for one event, decided before you send, never mixed into one number.

    One headline number; label the other separately.

  2. Ask everyone if you are small, rotate if you are not

    Under a few hundred customers ask everyone; above that rotate so nobody is asked twice a quarter. Keep new customers separate.

  3. Check the 0 to 10 row on a real handset

    Eleven touch targets need about 440 points of width at standard tap size, more than most phones have.[8] Check on a handset that it wraps.

  4. Fix the wave: same month, same wording, every time

    A relational wave goes out the same weeks each year, never reworded. A transactional send fires from the event, one per customer a quarter.

  5. Leave the open questions optional

    A compulsory free-text box loses finished surveys. Left optional, one vendor still sees 44 percent write something and 82 percent answer "why that number".[6]

    Both open boxes here are optional.

  6. Tag the reasons by band, detractor themes first

    Give each answer to question 2 one theme and its band. A theme only detractors raise is the first fix; one both raise is a feature.

Straight after a support call ends, the post call survey is already worded for that moment.

For a ticket, a repair or a visit, the customer service survey questions ask whether it was fixed and how hard it was, with no recommend item in the way.

One thing worth knowing before you send. Incentives are not worth it for a two-minute survey: they buy response, not representativeness.[9]

What to send promoters, passives and detractors

Every page on this subject tells you to close the loop and then stops. Here is what to actually write, for the awkward one first.

Answer inside two working days if you can, as a person with a name and a job title, and quote the person's own words back. It proves a human read it.

A passive gets one short question back: what would have made it a 10. A promoter gets thanks, what you did with their comment, and one low-pressure ask: an honest review or a name they could introduce you to.

Group every comment into a theme, count the themes, then say publicly what you are changing and why; nothing raises the next round's response rate like proof the last one mattered.

These bands sort promoters from detractors, not whether people would stay; the brand loyalty survey asks that directly.

NPS survey FAQ

What is an NPS survey?

A survey built around one question: how likely are you to recommend us to a friend or colleague, 0 to 10. Answers of 9 or 10 are promoters, 7 or 8 are passives, 0 to 6 are detractors. The result is promoters minus detractors as a percentage.

How do you calculate it?

Promoters as a percentage of everyone who answered, minus detractors as a percentage of everyone who answered. Passives sit in the denominator and in neither percentage. Do not average the 0 to 10 answers instead. See the calculator above for a worked example.

What is a good result?

There is no universal answer. Published benchmarks disagree by more than 30 points for the same sector, because each samples a different population and most are a vendor reporting on its own customers. Culture moves it too. Your own trend, on identical wording, beats every published table.

How many responses do I need before the number means anything?

More than most people have. At 20 responses, two people changing their minds moves the result by 20 points; at 200 the same two move it by two. Below about 50, report the band counts instead of the single number and read every comment.

Should I run it after every purchase or on a schedule?

Both exist and answer different questions. Transactional means sending it after one event, such as a delivery. Relational means sending it on a schedule, quarterly or twice a year. Pick one as your headline; do not add them together.

How do I stop people gaming the number?

Do not attach it to anybody's pay. Every documented gaming pattern follows the money rather than the method. Send to a defined population, keep a record of who was sent to as well as who answered, and publish the response rate next to the result.

Does NPS predict growth?

Sometimes. The strongest independent study followed 17 firms in five industries and found the score tracked revenue growth in some and not in others, and no better than a plain satisfaction score did. The defence is that it was never a forecast: one answer tells you nothing, while a few hundred over a year tell you which way service is moving. Bain itself says the damage came from tying the score to frontline pay. Used that way, as a trend on a decent sample, it is still the quickest single number for spotting the customers most likely to leave.

Methods and sources

What this template is based on

The recommend item is the standard wording in plainer English;[1] send-plan numbers come from the SuperSurvey Response Benchmark.[4]

Question licensing

Net Promoter, NPS and Net Promoter Score are trademarks and service marks of Bain and Company, Inc., NICE Systems, Inc., and Fred Reichheld.[1] SuperSurvey holds no licence, certification, endorsement or affiliation; the wording is free to use.

Limits and disclosure

The benchmark covers survey openers here; invitation rates are published figures with their own limits; industry benchmarks are vendor samples or consumer panels; none of this is legal advice.

SuperSurvey makes the editor this template opens in; everything here is free with or without it.

References

  1. Bain and Company. Trademarks and licensing. Required attribution: "Net Promoter(R), NPS(R), NPS Prism(R), and the NPS-related emoticons are registered trademarks of Bain & Company, Inc., NICE Systems, Inc., and Fred Reichheld. Net Promoter Score(SM) and Net Promoter System(SM) are service marks of Bain & Company, Inc., NICE Systems, Inc., and Fred Reichheld." netpromotersystem.com
  2. Keiningham, T.L., Cooil, B., Andreassen, T.W. and Aksoy, L. "A Longitudinal Examination of Net Promoter and Firm Revenue Growth." Journal of Marketing 71, no. 3 (2007): 39-51. measuringu.com
  3. Reichheld, F., Darnell, D. and Burns, M. "Net Promoter 3.0." Harvard Business Review, Nov-Dec 2021. bain.com
  4. SuperSurvey Response Benchmark, 16 September 2023 to 25 August 2026: 25,112 analysed surveys with 998,864 completed responses, out of 2,274,520 responses platform-wide. Method note.
  5. Retently. "What is a good Net Promoter Score?" Retently, 2026. retently.com
  6. CustomerGauge. "NPS survey best practices." CustomerGauge blog. customergauge.com
  7. Nielsen Norman Group. "Net Promoter Score: What a Score Means for UX." nngroup.com
  8. UX Stack Exchange, question 86975.
  9. Church, A.H. "Estimating the Effect of Incentives on Mail Survey Response Rates: A Meta-Analysis." Public Opinion Quarterly 57, no. 1 (1993): 62-79. academic.oup.com

Send the NPS survey this week

Seven questions, about two minutes, no email field. Open it in the editor, change the wording, and share one link.

Use this template